A Snapshot of Canada's Current Economic and Human Capital TrendsJuly 3, 2020Summary of 2020 Spring Flash Compensation Update Survey
The results included within this summary are based on over 400 participants in the 2020 Spring Flash Compensation Update Survey.
Survey submissions were collected between May and June 2020.
The focus of this report is on the impact COVID-19 has had on key Total Rewards Programs, as well as human capital management strategies in use in today's workplace.
We have also compared some factors to Flash Surveys from previous years to determine the relative impact on economic and human capital strategies.
The Wynford Group encourages you to contact us for more information on how we can work with your organization in addressing its Total Rewards needs.
For more detailed insights and in-depth data, please see our annual Canadian Salary Surveys. Click Here for more information.
2020 Base Salary AdjustmentsAverage Annual Base Salary Adjustments – By Industry
All
-1.52%
Utility/Telecom
2.40%
IT Services
2.10%
Financial Services
2.08%
Logistics/Transportation/Distribution
-0.42%
Manufacturing
-2.00%
Construction
-7.50%
Energy/Energy Services
-8.44%
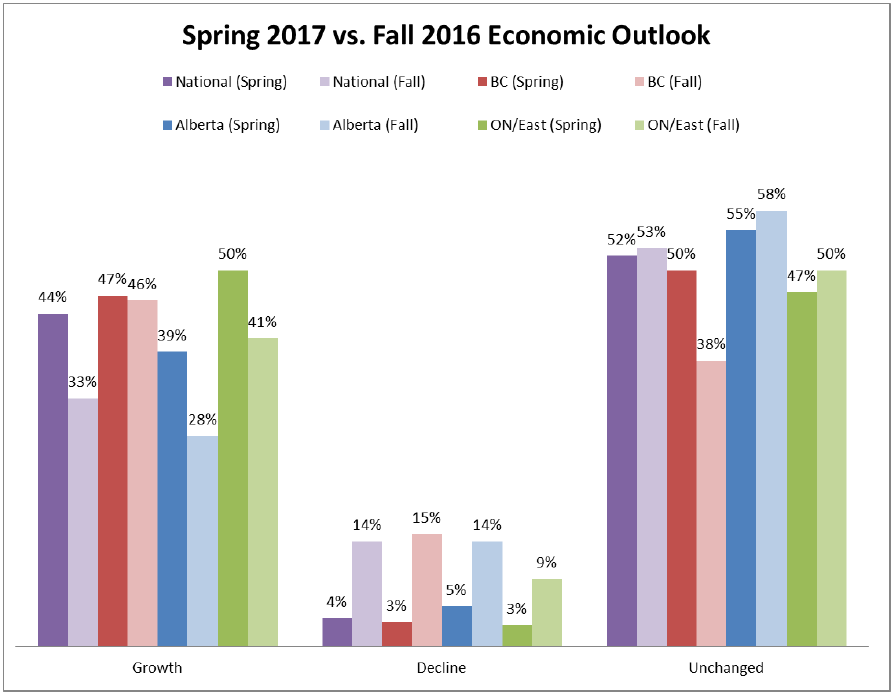
Economic Environment
**2019 decline numbers were not categorized to the specificity as 2020, therefore they are presented as the moderate category in this report.
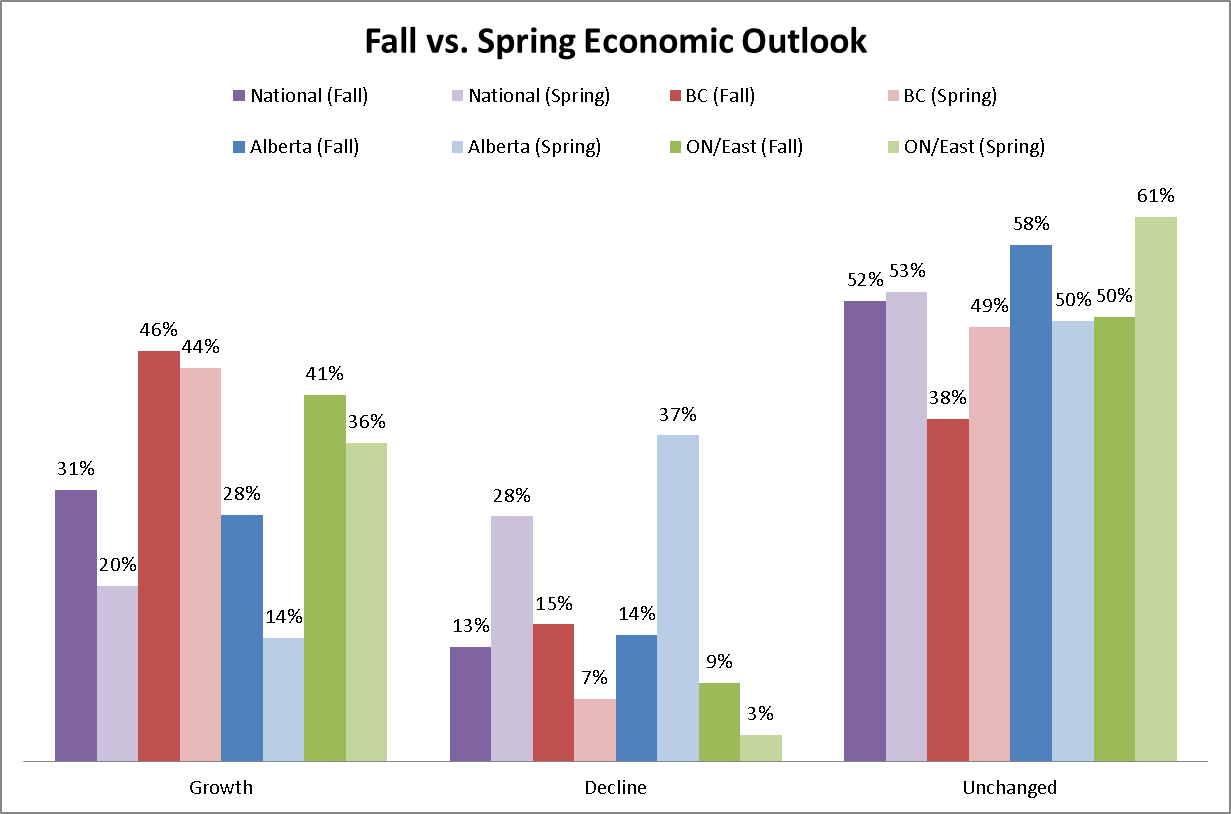
The chart above contrasts the economic outlook from Spring 2020 against Spring 2019. Key trends include:
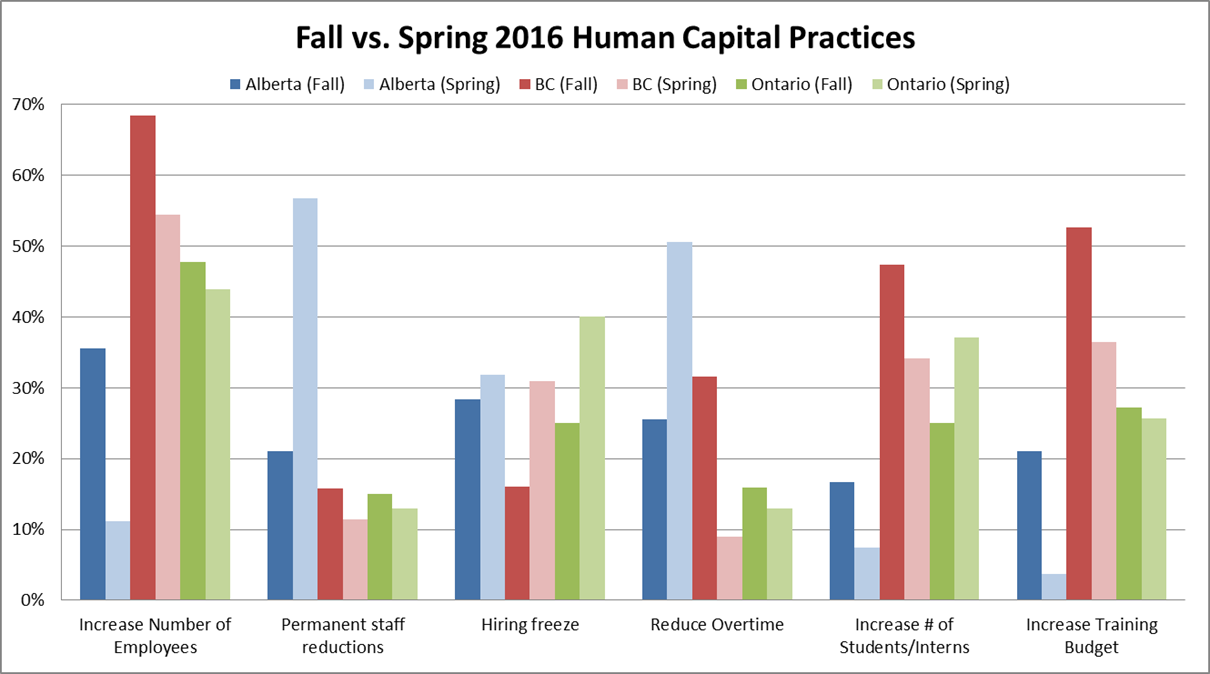
Human Capital Practices
Human Capital Practices have changed drastically in the first half of 2020. Key trends include:
Additional/Hazard Pay")
")
Additional Compensation Summary:
Human Capital Cost Management Strategies – 2020 Industry Breakdown
The review of Human Capital Cost Management Strategies indicate there are several industry sectors that have differing approaches regarding how they are implemented during the pandemic. Key highlights include:
Actions Organizations Will Take Post COVID-19
The graph above, displaying the several actions organizations will take as they emerge from COVID-19, shows that there are some organizational practices that remain a larger priority than others. Highlights include:
Construction and Mining Survey participation is still open until July 10th.
Please contact us at wynford@wynfordgroup.com or 1-877-264-5166 with any questions or concerns.
IMPORTANT DATES
Canadian Salary Survey Initial Online reports Distribution – Mid September 2020 Construction and Mining Initial Online reports Distribution – Early October 2020 Executive Initial Online Distribution – Mid October 2020 14th Annual Compensation Update Seminar Edmonton – TBA Calgary – TBA 2020 Fall Flash Survey – November Need More In-Depth Information?Wynford's Canadian Salary Surveys are just what you're looking for! Our user friendly cash data reports are broken down by three simple features including: Location, Industry and Revenue/Organization. |
||||||||||||||||||||||||
Total Rewards Forecasts and Insights for 2020January 10, 2019Summary of 2019 Fall Flash Compensation Update Survey
The results included in this summary are based on over 300 organization's submissions from across Canada between October and December 2019.
This summary provides insight into 2020 Salary Projections, Human Capital Management strategies and Benefits Policy currently employed in the workplace.
The Wynford Group encourages you to contact us for more information on how we can work with your organization in addressing its totals rewards and compensation needs.
For more detailed insights and in-depth data, please see our annual Canadian Salary Surveys.
2019 Base Salary AdjustmentsAverage Regional 2019 Base Salary Increases including 0's (%):
National
2.54
British Columbia
2.62
Quebec
2.59
Ontario
2.56
Alberta
2.48
Atlantic
2.46
Manitoba
2.44
Saskatchewan
2.37
2019 Base Salary Largest Increases by Industry including 0's (%):
Software Development
3.30
Advanced Technology
3.06
Agriculture/Cannabis
2.93
Professional Services
2.72
Manufacturing
2.65
IT Services
2.64
Construction
2.64
2019 Base Salary Smallest Increases by Industry including 0's (%):
Public Sector
2.00
Healthcare
2.00
EPC/EPCM
2.00
Logistics/Transportation/Distribution
2.24
Financial
2.25
Hospitality
2.32
Telecommunications/Utility
2.33
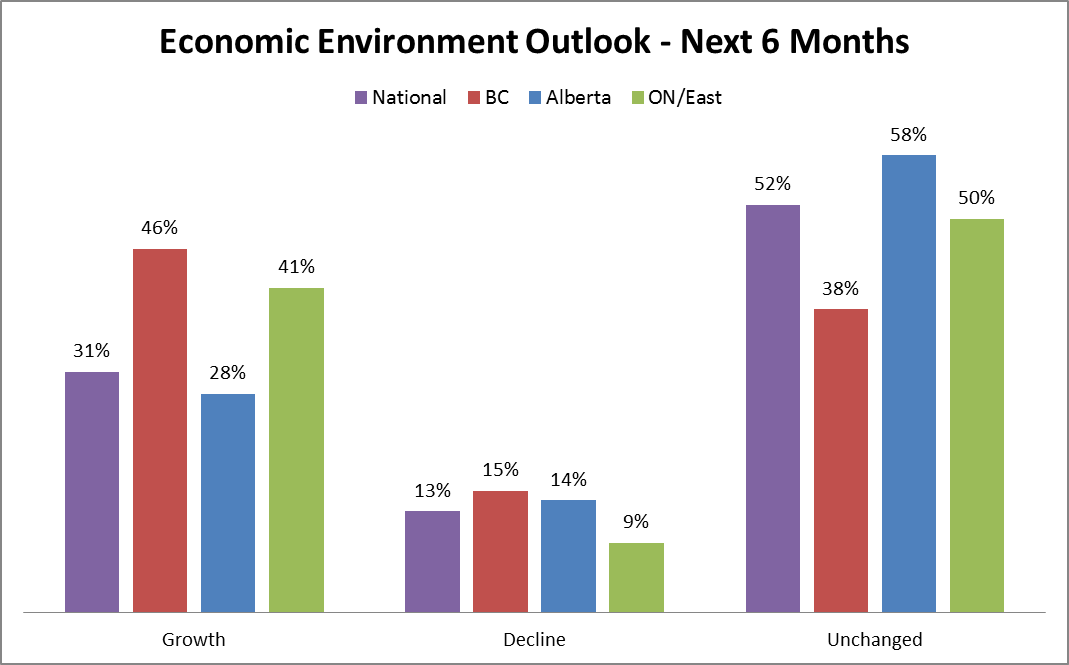
Economic Outlook
The graph above highlights several aspects of how participants view the 2020 Canadian economy.
Human Capital Practices
The table above highlights trends in several industries to paint a broader picture of Canada's overall economy as a whole. Highlights include:
Benefits Policy
Need More In-Depth Information?Wynford's Canadian Salary Surveys are just what you're looking for! Our user friendly cash data reports are broken down by three simple features including: Location, Industry and Revenue/Organization size.
The Wynford Group offers a complete range of services that can help you build your Total Rewards Program from the ground up. Our services include:
|
||||||||||||||||||||||||
Highlights of Wynford Group 2019 CannaBusiness Salary SurveyDecember 5, 2019
The Wynford Group is pleased to announce the completion of the inaugural CannaBusiness Salary Survey conducted in the summer of 2019. It includes market data from 38 Cannabis organizations and 47 positions across Canada and is part of Wynford's Canadian Salary Surveys with over 600 participants across Canada.
The CannaBusiness Survey is unique in providing competitive market information not only for this industry, but comparator industry data for other related industries including:
The results from the Survey revealed the following:


The Wynford Group offers a complete range of services that can help you build your Total Rewards Program from the ground up. Our services include:
Please contact us if you would like more information on how to interpret the market information and apply it to your organization. Subscribe to our Mailing List for latest information on upcoming events and services. |
||||||||||||||||||||||||
A Snapshot of Canada's Current Economic and Human Capital TrendsPrepared By: The Wynford GroupSummary of 2019 Spring Flash Compensation Update Survey
The results included within this summary are based on over 150 participants in the 2019 Spring Flash Compensation Update Survey.
The survey was initiated between April and June 2019 and reflects organization submissions from across Canada.
The focus of this report is on salary increases for 2019, as well as human capital management strategies currently in use in today's workplace.
We will also take a look back at our previous Spring Flash survey and highlight changes that we find significant as we proceed through the summer months of 2019.
The Wynford Group encourages you to contact us for more information on how we can work with your organization in addressing its totals rewards and compensation needs.
For more detailed insights and in-depth data, please see our annual Canadian Salary Surveys.
2019 Base Salary AdjustmentsAverage Regional 2019 Base Salary Increases including 0's (%):
National
2.53
British Columbia
2.60
Alberta
2.49
Saskatchewan
2.40
Manitoba
2.42
Quebec
2.58
Atlantic
2.32
Northern Canada
2.46
2019 Base Salary Greatest Increases by Industry including 0's (%):
Software Development
3.04
Advanced Technology
2.83
IT Services
2.55
Hospitality
2.50
Professional Services
2.48
2019 Base Salary Smallest Increases by Industry including 0's (%):
EPC/EPCM
2.08
Energy Services
2.09
Construction
2.22
Architecture
2.24
Retail
2.31
Economic Outlook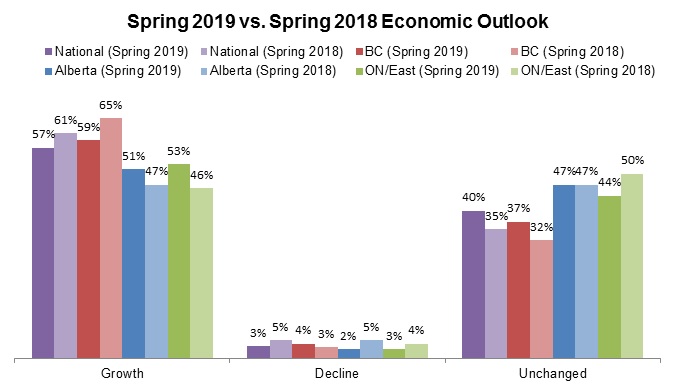
The graph above tells us several stories about how our participants view the Canadian economy in 2019:
Human Capital Practices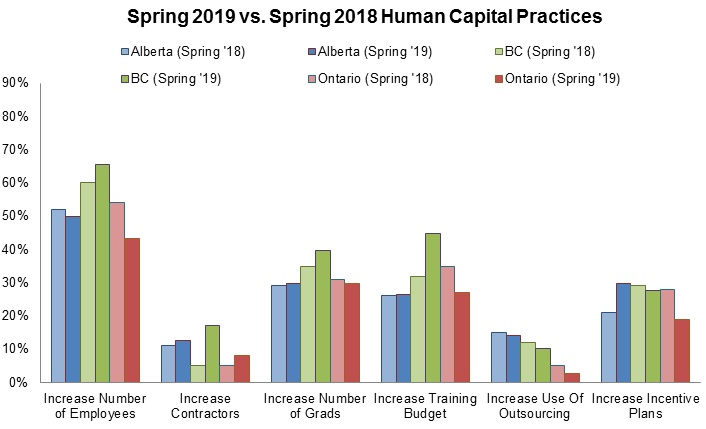
Highlighting the overall outlook of the Canadian economy for 2019 are the Human Capital Practices figures summarized in the graph above.
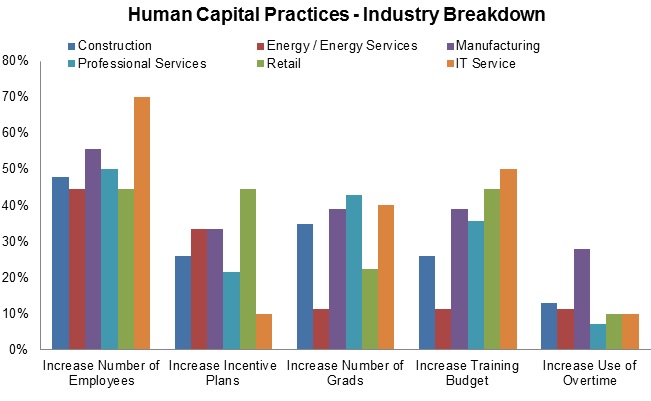
Breaking down the Human Capital Practices by industry provides an alternative perspective and shows which industries are more optimistic than others in 2019. Some of the highlights are as follows:
Need more in-depth data?
Wynford's Canadian Salary Surveys are just what you're looking for! Our user friendly cash data reports are broken down by three simple features including: Location, Industry and Revenue/Organization size. Canadian Salary Survey Initial Online reports Distribution - Mid September 2019 Construction and Mining Initial Online reports Distribution - Early October 2019 Executive Initial Online Distribution – Mid October 2019 14th Annual Compensation Update Seminar Edmonton - October 23rd 2019 Calgary - October 30th 2019 2019 Fall Flash Survey – November Subscribe to our Mailing List for latest information on upcoming events and services. |
||||||||||||||||||||||||
A snapshot of Canada's Dynamic Environment Compensation Trends and Forecasts for Summer 2018Prepared By: The Wynford GroupThe results included in this report are based on over 200 company submissions across Canada for the 2018 Spring Flash Survey between the months of April to June. The Wynford Group conducts FREE flash surveys every Spring and Fall to provide a snapshot on current compensation and human capital trends. The focus of this summary report is on salary increases implemented for 2018, as well as human capital management strategies currently in use across Canada. We hope that you find these results useful as your organization moves further into 2018. The Wynford Group encourages you to contact us for more information on how we can work with your organization in addressing totals rewards and compensation needs.
For more detailed insights and in-depth data, please see our annual Canadian Salary Surveys.
Actual 2018 Salary Increases - Including Zero'sAverage Regional 2018 Base Salary Increases: including 0's (%):
National
2.43
British Columbia
2.58
Alberta
2.39
Saskatchewan
2.30
Manitoba
2.47
Ontario
2.50
Quebec
2.48
Atlantic
2.30
2018 Base Salary Greatest Increases by Industry including 0's (%):
Software Development
3.00
Energy Services
2.53
Manufacturing
2.50
Advanced Technology
2.46
Financial
2.56
2018 Base Salary Smallest Increases by Industry including 0's (%):
Not For Profit
1.89
Public Sector
2.00
Mining
2.00
RPC / EPCM
2.06
Telecommunications / Utility
2.11
The graph above provides insight into how our participants view the Canadian economy in 2018:
Human Capital Practices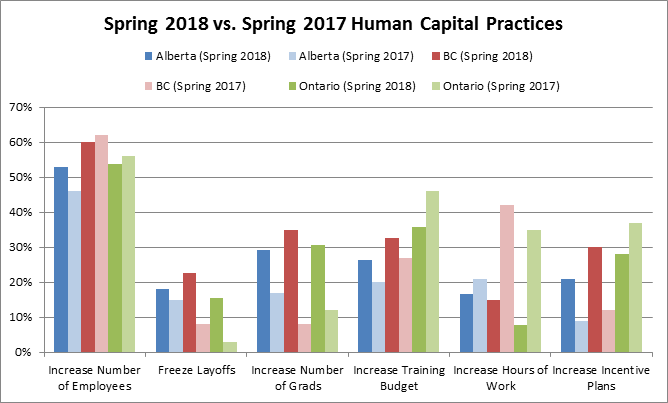
Helping to highlight the overall positive outlook of the Canadian economy for 2018 are the Human Capital Practices figures summarized in the graph above.
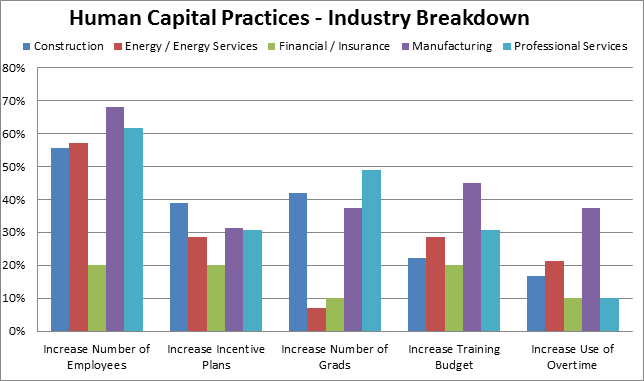
Breaking down the Human Capital Practices by industry provides an alternative perspective and shows which industries are more optimistic than others in 2018. Some of the highlights are as follows:
Subscribe to our Mailing List for latest information on upcoming events and services.
Canadian Salary Survey Initial Online reports Distribution - Mid September 2018 Construction and Mining Online reports Distribution - Early October 2018 13th Annual Compensation Update Seminar Edmonton - October 18th 2018 Calgary - October 31st 2018 Fall Flash Survey - November Need more in-depth data? Wynford's 2018 Canadian Salary Surveys and National Construction & Mining Surveys are currently available online! Our user friendly cash data reports are broken down by three simple features including: Location, Industry and Revenue/Organization size. |
||||||||||||||||||||||||
Sunny Days Ahead Total Rewards Insights and Forecasts for 2018Prepared By: The Wynford GroupThe results included in this report are based on over 250 company submissions from across Canada between October and December. The focus of this summary report is on salary increases for 2018, as well as human capital management strategies currently in use in today's workplace. We hope that you find these results useful as your company moves forward into 2018. The Wynford Group encourages you to contact us for more information on how we can work with your organization in addressing its totals rewards and compensation needs.
For more detailed insights and in-depth data, please see our annual Canadian Salary Surveys.
Actual 2018 Salary Increases - Including Zero'sAverage Regional 2018 Base Salary Increases:
National
2.42
British Columbia
2.60
Alberta
2.35
Saskatchewan
2.25
Ontario
2.30
Atlantic
2.30
2019 Base Salary Greatest Increase by Industry including 0's (%):
Highest
Lowest
Software Development
3.05
IT Services
2.21
Professional Services
2.75
Mining
2.20
Advanced Technology
2.57
Logistics/Transportation/Distribution
2.10
Manufacturing
2.50
Hospitality
2.06
Financial
2.45
EPC/EPCM
1.92
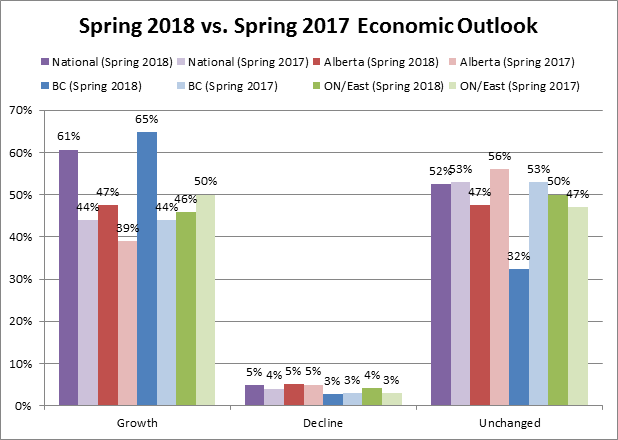
Economic Outlook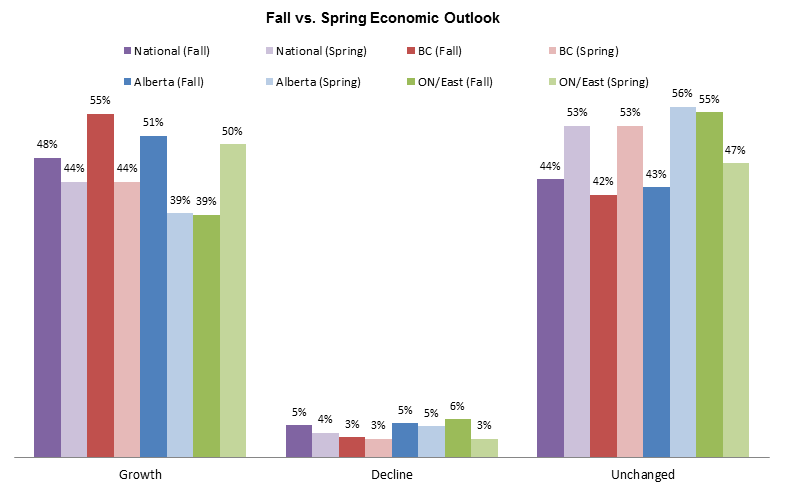
The graph above tells us several stories about how our participants view the Canadian economy in 2018:
Human Capital Practices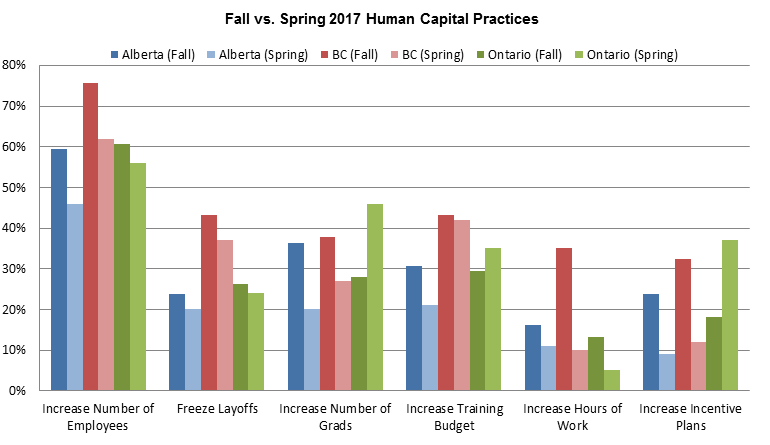
Helping to highlight the positive outlook of Alberta's economy for 2018 are the Human Capital Practices figures summarized in the graph above.
Human Capital Cost Management StrategiesA key function of this survey is not only to report on what organization's expect of the economy, but how they are dealing with these expectations in terms of their human capital. During the past few years we have seen a significant uptick in the use of cost saving practices by organizations in order to balance their books while maintaining bench strength. These practices varied in both size and severity throughout Canada and have left many individuals with reduced hours, wage freezes, or layoffs. Although we are beginning to see a reduction in policies such as these, many organizations are still employing cost saving strategies that impact the work force. These strategies are highlighted in the graph below.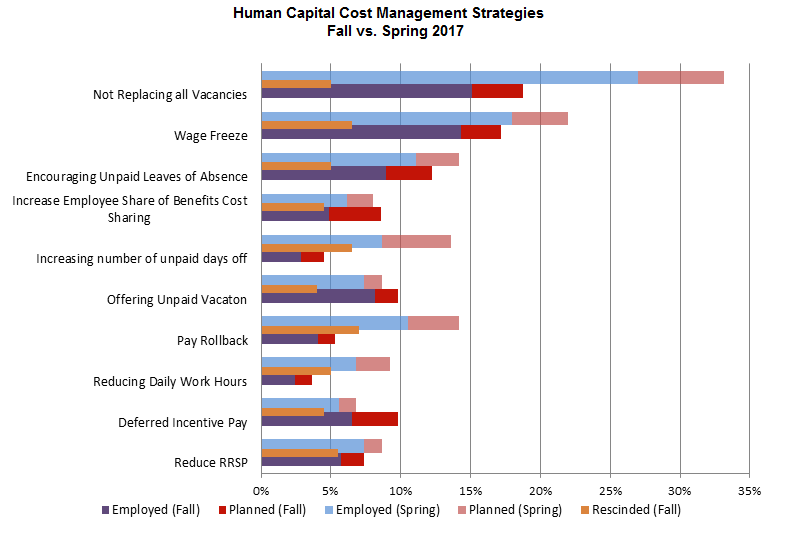
Many more participants are replacing current vacancies, rolling back wage freezes, and increasing the number of hours worked than were doing so during the spring of 2017.
We believe that these are all positive signs for the labor market, and the economy as a whole for 2018.
For more detailed insights and in-depth data, please see our annual Canadian Salary Surveys |
||||||||||||||||||||||||
The Storm Has Passed Compensation Trends and Forecasts for Summer 2017Prepared By: The Wynford GroupJune 2017The information presented in this report is a short sampling of results and interpretation of a survey submitted by over 200 participants from across Canada, compiled between April and June of 2017. The focus of the survey was on actual salary adjustments and impacts to compensation trends in 2017. We hope you find these results valuable, and encourage you to contact us for more information or to learn how the Wynford Group can work with your organization for any compensation or management consulting requirements.
For more detailed insights and in-depth data, please see our annual Canadian Salary Surveys.
Economic Outlook
Overall, the results of these responses indicate a positive outlook for economic growth and maintained levels of business for the majority of participants.
Actual 2017 Salary IncreasesHighest Average Regional 2017 Base Salary Projection Increases (Including 0's):
National
1.72
British Columbia
2.00
Ontario
1.81
Quebec
1.73
Alberta
1.55
Average Industry 2017 Base Salary Projection Increases (including 0's):
Highest
Lowest
Insurance
2.39
Energy
1.85
Professional Services
2.39
Energy Services
1.78
EPC/EPCM
2.27
Mining
1.75
Architecture
2.25
IT Service
1.55
Advanced Technology
2.23
Not For Profit
1.25
Average Regional 2017 Base Salary Increases (Excluding 0's):
National
2.25
British Columbia
2.38
Alberta
2.08
Saskachewan
2.02
Manitoba
1.99
Ontario
2.31
Quebec
2.15
Atlantic
2.04
Northern Canada
1.96
Average Industry 2017 Base Salary Projection Increases (Excluding 0's):
Highest
Lowest
Insurance
2.58
Not For Profit
1.93
Architecture
2.50
Energy
1.90
Hospitality
2.50
Retail
1.90
Profesionnal Services
2.40
Energy Services
1.85
Financial
2.38
IT Service
1.65
Human Capital Practices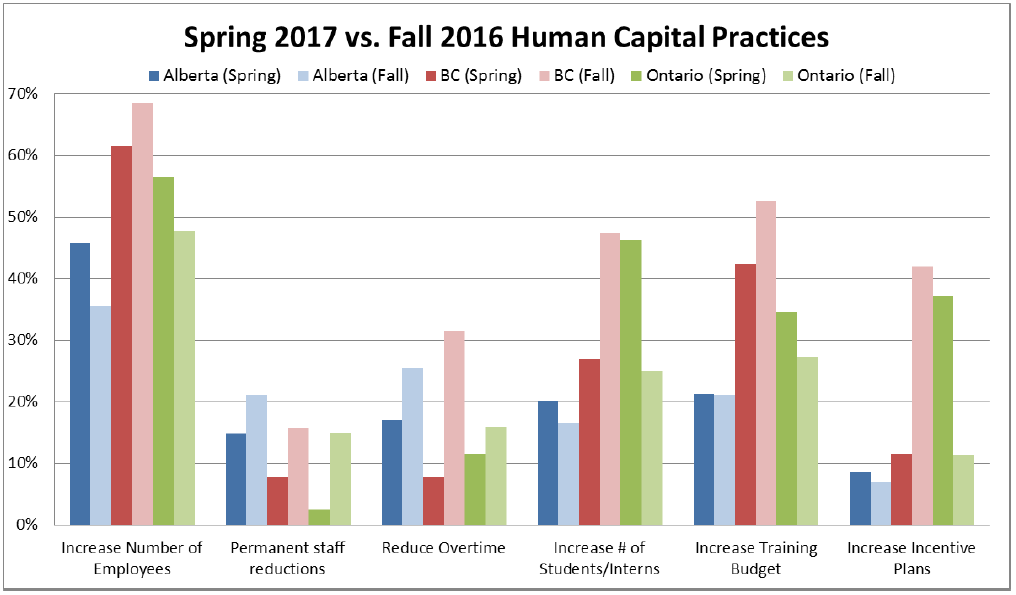
Highlights of the table above are as follows:
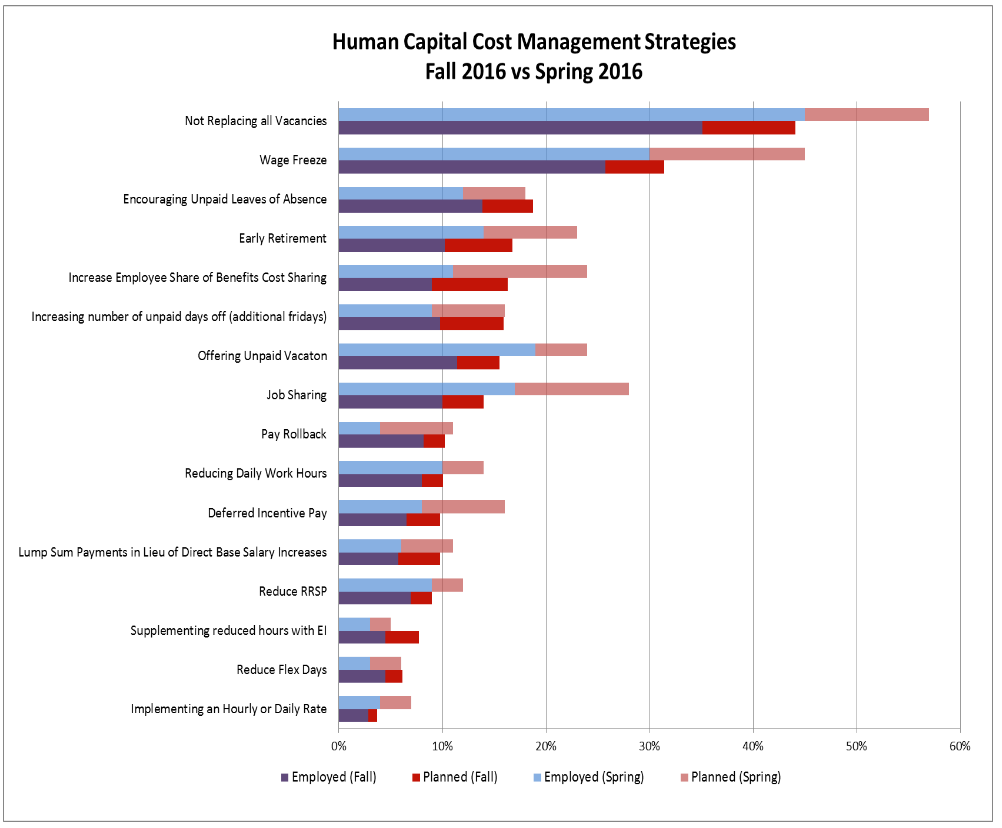
Human Capital Cost Management StrategiesA key function of this survey is not only to report on what organizations expect of the economy, but how they are dealing with these expectations in terms of their human capital. The Wynford Group aims to provide employers with options when exploring human capital cost savings. For several years we have asked participants which of the following cost saving strategies they currently have in place, or plan on using in the coming months. This helps gauge the common techniques used in today's market, and how they have adapted over time. Below is a graph of these results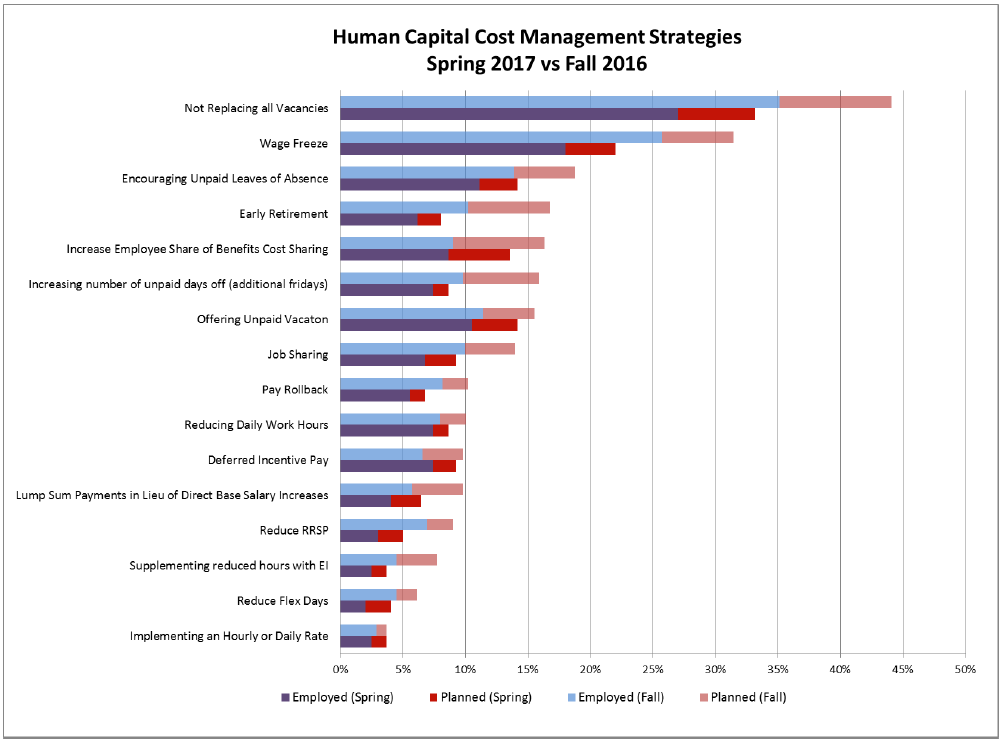
The graph above provides participants a summary of the cost management strategies currently being used in Canada to save on human capital.
The figures above tell us a story of the market for labor, as well as the overall health of our participant organization's businesses.
Since our previous Flash Survey in Fall 2016, all cost reducing strategies for human capital have decreased.
For more detailed insights and in-depth data, please see our annual Canadian Salary Surveys
|
||||||||||||||||||||||||
2017 Wynford Surveys & Salary Projections
|
||||||||||||||||||||||||
Looking Forward:
|